|
Original Article
Effect of intersubject variability of extrathoracic morphometry, lung airways dimensions and respiratory parameters on particle deposition
Majid Hussain1,2, Winker-Heil Renate1,Hofmann Werner1
1Division of Physics and Biophysics, Department of Materials Research and Physics, University of Salzburg, Hellbrunnerstrasse 34, A-5020 Salzburg, Austria; 2Higher Education Commission, Islamabad, Pakistan
This work was supported by the Higher Education Commission of Pakistan.
Authors would like to thank Dr. Pierre Madl for his editorial assistance in preparation of the manuscript.
Corresponding to: Majid Hussain, MS. Division of Physics and Biophysics, Department of Materials Research and Physics, University of Salzburg, Hellbrunnerstrasse 34, A-5020 Salzburg, Austria. Tel: +43-662-8044-5718; Fax: +43-662-8044-5718. Email: majid.hussain@sbg.ac.at.
|
|
Abstract
Objective The structure of extrathoracic passages exhibit significant intersubject variations, which affects extrathoracic deposition and, in further consequence, the fraction of inhaled particles actually reaching the thoracic region. Thus extrathoracic deposition variability determines not only fluctuations of tracheobronchial and alveolar deposition fractions but also of total deposition.
Methods The major sources of the intersubject variability of lung deposition are the asymmetry and variability of airway tracheobronchial and alveolar dimensions, the allometric relationship between morphometry and height and age, and the correlation between the extrathoracic geometry and tracheal airway dimensions. The third major factor of intersubject variability of regional and total deposition is individual variations of breathing patterns obtained from measurements in human subjects.
Results To quantify the intersubject variability of extrathoracic, thoracic and total deposition fractions, different combinations of the three sources of variability were simulated to identify the most important factors. While some combinations enhance the effects of individual factors on deposition by up to 40%, others seem to compensate each other with only a minor effect on deposition.
Conclusion The present study attempts to quantify experimentally observed intersubject variability of regional deposition fractions caused by individual variations of nasal and oral geometry, lung airway dimensions and breathing patterns in healthy lungs, serving as a baseline for subsequent calculations for diseased lungs, e.g. asthma, COPD, and emphysema, which may further increase intersubject variabilities of medically relevant depositions.
Key words
extrathoracic geometry; lung airways; intersubject variability; lung deposition modeling
J Thorac Dis 2011;3:156-170. DOI: 10.3978/j.issn.2072-1439.2011.04.03
|
|
Introduction
The extrathoracic (ET) region (nasal and oral passages, pharynx and larynx) of the human respiratory tract serves as an important first stage filter for inhaled particulates entering the thoracic region (tracheobronchial and pulmonary regions), i.e. the lungs per se, of the human respiratory tract. For medical aerosol administration and measurements of aerosol deposition in the human lung, consideration of particle deposition in the extrathoracic region is of utmost importance as it eventually determines the fraction of inhaled particles actually entering the lungs.
Due to the complex morphometry of the ET region and the resulting intersubject variability, it is presently not possible to derive specific analytical models for the estimation of deposition efficiencies, although very promising results have been obtained by computational fluid dynamics (CFD) ( 1- 4). Thus the modeling approach currently taken is to develop semi-empirical deposition equations for nasal and oral deposition by fitting available experimental data as functions of physical deposition parameters. However, the complexity of the extrathoracic region, which depends on gender, age and health condition, results in different experimental deposition efficiencies and hence in different deposition equations. Since experimental data from in-vivo studies have revealed significant intersubject variations, particularly for high nasal/oral deposition efficiencies ( 5), various authors attempted to explain these differences by the specific geometry of nasal and oral airway passages in these volunteers ( 6- 9). For example, Cheng
( 10) proposed an average shape factor ( sf) and a minimum cross
sectional area ( Amin) to predict the variability of in-vivo nasal
deposition in the diffusion and the inertial impaction regime
respectively. For the calculation of the intersubject variability in
oral airways in the impaction regime, Cheng ( 10) approximated
the Stokes number as a function of an equivalent diameter ( d)
while Grgic et al. ( 11) approximated it as a function of the
mouth-throat volume ( V) and centerline path length ( L). Garcia
et al. ( 12) developed an alternative approach to find interindividual
variability in nasal filtration as a function of nasal
cavity geometry by relating it to the trans-nasal pressure drop.
Since the range of the morphometric parameter values were also
reported in these studies, they can be used to predict intersubject
variability of ET deposition. In a previous study, Hofmann et al. ( 13, 14) investigated the effect of intersubject variability of airway dimensions in the thoracic region on total deposition fractions (TDF). Since TDF may be significantly affected by ET deposition, the intersubject variability of the ET region has been correlated in the present study to the intersubject variability of the thoracic region. This correlation is based on the observation that the dimensions of the trachea are closely related to the head region rather than to the lungs ( 6). Hence the geometric parameters of the ET regions are related to the randomly selected lung structure by the scaling factor (SF) ( 6), which is defined as the ratio of the tracheal diameters in a reference adult to that given subject. In-vivo measurements of nasal and oral deposition efficiencies were commonly carried under well defined breathing conditions. For normal breathing, however, significant intersubject variations of tidal volume ( VT), breathing frequency (f) and functional residual capacity (FRC) could be observed ( 15, 16). Therefore, in addition to the intersubject variability of the nasal and oral geometry, the variability of the breathing pattern and lung scaling through FRC will also contribute to the overall predicted intersubject variability of ET and TDF. Thus the primary objectives of the present study are (i) to quantify intersubject variations of nasal and oral deposition efficiencies for inhalation and exhalation based on semi-empirical equations as well as from ET morphometric parameters; (ii) to evaluate their effects generational deposition (inhalation plus exhalation); (iii) to evaluate intersubject variations produced by the scaling factor (SF), with and without lung airway scaling, (iv) to compare intersubject variations produced by the SF, lung airway dimensions and with those caused by the variability of the respiratory parameters.
|
|
Methods
Assuming that the differences between several semi-empirical ET deposition equations based on human volunteers and ET-casts can be attributed primarily to intersubject variations of nasal and oral geometries, ET deposition was computed by inserting different semi-empirical deposition equations (Appendix) into the deposition model.
To analyze the intersubject variability caused by nasal and oral morphometric parameters, nasal airway dimensions measured by Cheng et al. ( 17) in 10 adult male subjects ( Table 1) and a set of mean oral diameters obtained from seven mouth-throat geometries defined by Grgic et al.( 11) ( Table 2) were used. For ultrafine particles (≤0.2 μm), diffusion is the dominant deposition mechanism and hence the nasal deposition efficiency is expressed as a function of the diffusion coefficient ( D) and flow rate ( Q) by fitting equation 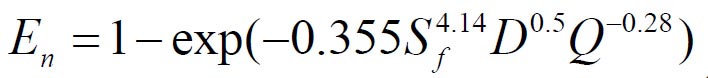 , where S f , is the average shape factor of the nasal turbinate region( 10). For large particles (> 0.2 μm), impaction is the dominant deposition mechanism and the nasal deposition efficiency is calculated by as a function of the aerodynamic diameter ( da) and flow rate ( Q) by fitting equation 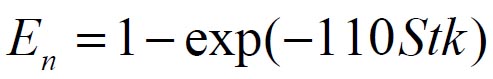 , the where dimensionless Stokes number 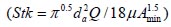 depends on the nasal cross sectional area A min ( 10). For oral deposition in the diffusion region no correlation between oral geometry and deposition efficiency has yet been found. However, in the inertial impaction regime, the deposition efficiency was calculated as function of the aerodynamic diameter ( da) and the air flow velocity ( U) by fitting equation 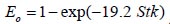 , where Stk is the dimensionless Stokes number 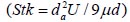 . This Stokes number depends on the characteristic length which is assumed to be the equivalent diameter of the average cross sectional area of the oropharyngeal region ( 10) ( Table 2). Since coefficients for expiratory deposition are not significantly different from inspiratory deposition ( 10), the same equation was used in this paper for extrathoracic deposition calculations. To model the effects of individual anatomical dimensions of extrathoracic and thoracic airway relative to an adult reference man, ICRP ( 6) proposes the application of the scaling factor SF. This factor also relates the extrathoracic geometry to the tracheal diameter i.e. SF = 1.65⁄ do, where do is the diameter of the trachea in units of centimeters. Tracheal diameters can either be randomly selected from a defined tracheal diameter distribution or can be directly related to the height of a subject by the allometric equation 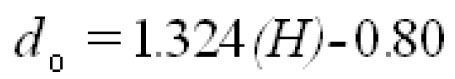 , where H is measured in units of meter. This equation was obtained by fitting published data on the relationship between subject height and tracheal diameter ( 18). This SF is incorporated into the modified ICRP equations 1a-4a (Appendix) to determine their effect on particle deposition. Significant intersubject variability due to different respiratory parameters, such as functional residual capacity (FRC), tidal volume ( VT) and breathing frequency ( f), was found in 25 male and female subjects ( 15, 16). Airway dimensions, i.e. lengths and diameters of bronchial and acinar airways were scaled in proportion to the third root of the individual functional residual capacity (FRC) ( 6), where FRC is calculated as a function of age ( A), height ( H) and gender of a given subject. For example, 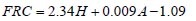 for males and 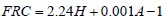 for females. Deposition fractions of inhaled particles were computed by the stochastic airway generation model IDEAL (Inhalation, Deposition and Exhalation of Aerosols in the Lung), originally developed by Hofmann and Koblinger ( 19) and Koblinger and Hofmann ( 20), but revised many times in the years thereafter ( 13, 16, 19, 21, 22, 23). Formulated mathematically as a Langrangian random pathway model, airway dimensions are randomly selected by parameter probability density functions and correlations among several of these parameters, which were derived from measured morphometric data ( 24, 25). The paths of individual inhaled particles through the random airway geometry are simulated by Monte Carlo methods. The diffusion deposition efficiency in bronchial airways was calculated by the deposition equations proposed by Ingham ( 26) for laminar flow and by Cohen and Asgharian ( 27) for developing flow. For sedimentation, the equations of Yeh and Schum ( 28) and for impaction Zhang et al.( 29) were used (Appendix).
| Table 1. Nasal airway dimensions Sf and Amin in 10 subjects (17) |
| Subjects† |
A |
B |
C |
D |
E |
F |
G |
H |
I |
J |
Mean±SD |
| Sf |
2.90 |
2.76 |
2.62 |
2.60 |
2.45 |
2.56 |
2.42 |
2.29 |
2.38 |
2.09 |
2.51±0.23 |
| Amin (cm2) |
2.28 |
1.65 |
2.42 |
2.21 |
1.87 |
3.10 |
3.10 |
2.06 |
1.54 |
2.37 |
2.1±0.52 |
| Height (m) |
1.92 |
1.85 |
1.78 |
1.73 |
1.70 |
1.83 |
1.67 |
1.91 |
1.65 |
1.85 |
1.79±0.10 |
| †The subjects include mixed ethnicity males and females aged 24-58 years with heights of 1.65-1.93m. |
| Table 2. Oral airway mean diameters of seven realistic mouth throat models† based on MRI scans (13) |
| Model |
Idealized‡ |
S1a§ |
S1b§ |
S2 |
S4 |
S5a§ |
S5b§ |
S3 |
Mean±SD |
| dmean |
2.1 |
1.8 |
1.5 |
2.5 |
2.4 |
2.6 |
2.8 |
2.0 |
2.21±0.43 |
| †The model includes Caucasian male and female subjects aged 23-43 years; ‡Subject representing average geometry of actual subjects; §Model with intrasubject geometric configurations. |
|
|
Results
Deposition fractions for unit density monodisperse particles in the size range of 1 nm to 10 μm were computed for sitting and light exercise breathing conditions. Flow rates for sitting and light exercise conditions are assumed to be 18 and 50 L min -1 respectively ( 8). Furthermore, uniform breathing with equal inspiration and expiration and zero breath hold time was considered. These input data were used to obtain nasal, oral and TDF for all subjects.
Effect of variable ET geometry on deposition
The simulated effects of intersubject variability in nasal airways dimensions and its effect on nasal and total deposition are presented in Fig 1. In these simulations intersubject variations of the nasal deposition are determined primarily by corresponding fluctuations of S f, and A min. Simulations revealed that deposition increases proportionally with increase in S f in the diffusion dominant regime and with decrease in A min in the impaction regime. In the diffusion regime, nasal deposition efficiency decreases with increase in particle size and with decrease in flow rate. In the impaction regime it increases distinctly with increase in particle size and flow rate ( Tables 3- 6). But TDF increases with a growing flow rate in both regimes except for the intermediate particle size range (0.07–0.2 μm). The intersubject variations of the oral deposition are determined by corresponding fluctuations of oral equivalent diameter d. The simulations in the impaction regime revealed that deposition is high for small values of a given d ( Fig 2). Deposition efficiency increases with rising particle size and flow rate. For different subjects, a large variability in oral deposition was observed. Higher values of deposition efficiencies are observed with oral breathing in the thoracic region as compared to nasal breathing.
Intersubject variability caused by different semi-empirical deposition equations
Semi-empirical nasal and oral deposition equations were used in this study assuming that these equations primarily reflect intersubject variations, provided that identical breathing conditions and aerosol data are used. Figs 3- 4 exhibit deposition efficiencies in nasal and oral airways and consequently in TDF using these equations. For nasal deposition, Asgharian ( 30) and Martonen et al. ( 2) have derived equations for fine particles size ≤ 2 μm only. The equation derived by Martonen et al. ( 2) produces comparatively higher deposition fractions, possibly due to the consideration of 70% turbulent flow compared to 30% laminar flow (Appendix). The deposition fraction derived from NCRP ( 31) and ICRP ( 6) yield quite similar results in the diffusion regime as compared to impaction regime where NCRP equations give somewhat lower deposition fractions. This is most likely due to the lower value of the coefficient derived for the impaction parameter.
Generational deposition fraction
The generational deposition fractions are significantly different for all 10 subjects for 1nm and 10 μm sized particles up to generation 15 ( Fig 5). The deposition fractions for 1 nm particles exhibit two maxima, the first in generation 1 and the second around generation 5. The later is shifted to about generation 7–8 under light exercise breathing conditions. The generational deposition fractions for intermediate particle diameter do not show much variability in all 10 subjects. For 10 μm sized particles, very low deposition fractions up to generation 23 can be observed. The generational deposition fractions for 0.4 μm sized particle in airway generations do not show much variability for all 5 subjects except for an idealized mouth ( Fig 6). The highest deposition fraction is about 2% in generation 20 for both breathing conditions. The deposition fractions for 10 μm sized particle exhibit variability in each generation up to generation 24. For light exercise breathing conditions, deposition fractions are highest in the first generation and gradually decrease in subsequent generations.
Intersubject variability caused by SF and lung airway scaling
The effect of the correlation between SF and the scaling of the lung dimensions using the ICRP equations for nasal and thoracic deposition are shown in Figs 7 and 8 (mean values and standard deviations) for both nasal and oral breathing respectively. Significant variability in thoracic deposition can be observed during both sitting and light exercise breathing conditions. Comparison of deposition fractions with lung scaling shows a higher variability as compared to simulations without lung scaling ( Tables 3- 6).
Intersubject variability caused by SF, lung airway scaling and different breathing patterns
Fig 9 shows intersubject variability of particle deposition due to SF, different breathing patterns and lung scaling in 25 male and female subjects. The mean values and standard deviation for age and height of the subjects used in this study were 25 ± 3.35 yr and 1.74 ± 0.1 m respectively. The mean values and standard deviations for breathing parameters were 3220 ± 605 mL for FRC, 670 ± 138 mL for VT, 15.6 ± 4.43 min -1 for f, and 21 ± 7 L min -1 for the flow rate. Residence times of aerosols in the lungs and hence their deposition probabilities by diffusion or sedimentation are controlled by three parameters: FRC, VT, and f. At present no definite correlation between these parameters could be found. However, using a fixed value of the FRC and an increased tidal volume enhances the flow rate and thus an increase in ET as well as thoracic deposition can be observed. This increase in both deposition fractions are affected inversely with a decrease in breathing frequency of the same subject. If individual breathing patterns are considered, a smaller variability in the diffusion regime is found for the ET region, while a 3–4 times higher variability can be observed for thoracic deposition ( Tables 3- 6). In the impaction regime, the variability in the ET region is higher than that for thoracic deposition.
Comparison of intersubject variability based on the Coefficient of Variation (CV)
The coefficient of variation is defined as the ratio of the standard deviation to the mean value of the deposition fraction. A comparative overview of the variability of deposition in ET and TDF in terms of CV for sitting breathing conditions is shown in Fig 10. Incorporation of geometric parameters tends to increase the CV. The maximum values of CV during nasal and oral breathing are 0.75 and 1.41, respectively. For thoracic deposition, the maximum value of CV is 0.26 and 0.12 for nasal and oral breathing conditions respectively. Larger values of CV are observed in the diffusion regime when different formulas for nasal breathing are employed while they decrease in the impaction regime. This larger variability when using different deposition formulas seems to be related to causes other than intersubject variability. Without lung scaling, lower variability is observed in the diffusion regime as compared to the impaction regime for both ET and TDF. In the impaction regime, lung scaling according to age and height yields a CV value up to 0.23 for TDF as compared to 0.01 for oral breathing without lung scaling. For nasal breathing, the observed CV values were 0.23 and 0.19 with and without lung scaling, respectively.
Intersubject variability for different subjects caused by SF, lung scaling and consideration of different breathing patterns produces the highest values of CV, e.g. 0.3 and 0.42 for TDF in nasal and oral breathing, respectively. The larger values of CV when considering SF, lung scaling and individual breathing pattern shows that variation in deposition increases with the consideration of individual physical and breathing parameters.
| Table 3. Summary of nasal deposition fractions in 10 different subjects under sitting breathing conditions using different deposition equations. |
| Particle diameter (µm) |
Cheng(10) equation† |
Other equations‡ |
ICRP equation without lung
scaling |
ICRP equation
with lung scaling§ |
ICRP equation with different breathing patterns§ |
| 0.001 |
0.80±0.23 |
0.91±0.14 |
0.87±0.005 |
0.88±0.009 |
0.88±0.018 |
| 0.01 |
0.30±0.13 |
0.23±0.12 |
0.22±0.004 |
0.22±0.007 |
0.22±0.012 |
| 0.1 |
0.05±0.02 |
0.06±0.13 |
0.04±0.001 |
0.04±0.002 |
0.04±0.002 |
| 1 |
0.09±0.08 |
0.12±0.05 |
0.17±0.07 |
0.17±0.07 |
0.2±0.09 |
| 5 |
0.78±0.20 |
0.74±0.11 |
0.78±0.08 |
0.79±0.08 |
0.82±0.08 |
| 10 |
0.99±0.02 |
0.93±0.13 |
0.92±0.03
|
0.93±0.03 |
0.94±.03 |
| †see equation 9 in the Appendix; ‡other equations include average deposition fraction obtained from ICRP (6) , NCRP (31), Cheng (10), Martonen et al. (2), Asgharian et al. (30); §see equations 1a and 3a in the Appendix. |
| Table 4. Summary of thoracic deposition fraction in 10 different subjects under sitting nasal breathing condition using different deposition equations. |
| Particle diameter (µm) |
Cheng(10) equation† |
Other equations‡ |
ICRP equation without lung
scaling |
ICRP equation
with lung scaling§ |
ICRP equation with different breathing patterns§ |
| 0.001 |
0.18±0.02 |
0.08±0.012 |
0.12±0.001 |
0.11±0.001 |
0.11±0.004 |
| 0.01 |
0.54±0.05 |
0.57±0.05 |
0.61±0.002 |
0.59±0.014 |
0.57±0.05 |
| 0.1 |
0.30±0.02 |
0.29±0.11 |
0.29±0.0001 |
0.29±0.055 |
0.26±0.09 |
| 1 |
0.19±0.07 |
0.17±0.05 |
0.16±0.06 |
0.16±0.076 |
0.14±0.07 |
| 5 |
0.18±0.05 |
0.21±0.03 |
0.17±0.021 |
0.17±0.024 |
0.14±0.02 |
| 10 |
0.01±0.002 |
0.06±0.013 |
0.06±0.003
|
0.06±0.004 |
0.05±0.004 |
| †see equation 9 in the Appendix; ‡other equations include average deposition fraction obtained from ICRP(6) , NCRP(31), Cheng(10), Martonen et al.(2), Asgharian et al. (30); §see equations 1a and 3a in the Appendix. |
| Table 5. Summary of oral deposition fraction in 7 different subjects under sitting breathing conditions using different deposition equations. |
| Particle diameter (µm) |
Cheng(10) equation† |
Other equations‡ |
ICRP equation without lung
scaling |
ICRP equation
with lung scaling§ |
ICRP equation with different breathing patterns§ |
| 0.001 |
- |
0.73±0.166 |
0.64±0.008 |
0.65±0.014 |
0.65±0.025 |
| 0.01 |
- |
0.12±0.11 |
0.12±0.002 |
0.12±0.009 |
0.12±0.007 |
| 0.1 |
- |
0.02±0.02 |
0.02±0.0001 |
0.019±0.001 |
0.019±0.001 |
| 1 |
0.01±.013 |
0.005±.007 |
0.004±0.001 |
0.004±0.001 |
0.005±0.002 |
| 5 |
0.15±0.19 |
0.17±0.05 |
0.22±0.057 |
0.22±0.046 |
0.26±0.091 |
| 10 |
0.41±0.38 |
0.53±0.18 |
0.64±0.076
|
0.64±0.061 |
0.68±0.099 |
| †see equation 10 in appendix; ‡other equations include average deposition fraction obtained from ICRP (6), NCRP(31) and Cheng(10); §see equations 2a and 4a in Appendix. |
| Table 6. Summary of thoracic deposition fraction in 10 different subjects under oral and sitting breathing conditions using different equations. |
| Particle diameter (µm) |
Cheng(10) equation† |
Other equations‡ |
ICRP equation without lung
scaling |
ICRP equation
with lung scaling§ |
ICRP equation with different breathing patterns§ |
| 0.001 |
- |
0.24±0.02 |
0.34±0.001 |
0.32±0.003 |
0.31±0.011 |
| 0.01 |
- |
0.65±0.04 |
0.65±0.001 |
0.64±0.057 |
0.63±0.06 |
| 0.1 |
- |
0.30±0.02 |
0.30±0.0001 |
0.29±0.056 |
0.26±.092 |
| 1 |
0.18±0.01 |
0.17±0.01 |
0.17±0.001 |
0.17±0.044 |
0.15±0.068 |
| 5 |
0.57±0.08 |
0.56±0.024 |
0.53±0.025 |
0.52±0.079 |
0.48±0.059 |
| 10 |
0.49±0.09 |
0.40±0.04 |
0.31±0.015
|
0.31±0.025 |
0.27±.022 |
| †see equation 10 in appendix; ‡other equations include average deposition fraction obtained from ICRP (6), NCRP (31) and Cheng (10); §see equations 2a and 4a in appendix. |
|
|
Discussion
Effect of variable ET geometry on deposition
The use of different anatomical data affects nasal, oral and thoracic deposition and seems to be major controlling factors for the experimentally observed intersubject variability in ET airways. Larger values of Sf are a measure of larger complexity, which increases turbulences and results in secondary flows which in turn increase particle deposition. On the other hand, smaller values of Amin, which is variable during the breathing cycle, impede air flow, and hence increase deposition. At very low and high flow rates, the deposition efficiencies for 1 nm and 10 μm particles approach 100% in nasal airways. Deposition of ultrafine particles increases with the diffusion coefficient and with longer residence times in the airways. Hence, low flow rates and smaller particle diameters produce higher deposition efficiencies in the diffusion regime. For oral breathing in the impaction regime, smaller values of d and higher flow rates cause higher deposition efficiencies. The higher oral deposition efficiency in the impaction regime is caused by increased turbulences in the narrow parts of the oral passage.
Generational deposition efficiencies
For nasal breathing the deposition fraction for 1 nm particles in the first generation are high relative to the following generations. This is due to turbulent flow caused by the complex geometry of the ET region. However, after passing through the trachea, the flow becomes smooth and deposition fraction decreases up to generation 5 to 8, depending upon the flow rate. Similar behavior of deposition can be observed for 10 μm size particles with the highest deposition in generation 10 ( Fig 5). Deposition fractions of large particles within the thoracic region are higher for oral breathing as compared to nasal breathing due to the lower oral filtration efficiency. The variability of deposition efficiencies in different generations also affects TDF. The relative variability in thoracic deposition tends to be high for low thoracic deposition and low for high thoracic deposition as the case of 1 nm and 10 μm particles ( Figs 5- 6). This effect of relative variability in ET and thoracic region is consistent with the findings of Borgström et al.( 32) In the diffusion regime, a higher flow rate decreases deposition in the ET region but increases it in thoracic region. In the impaction regime, ET as well as thoracic deposition rise with an increase in flow rate, similar to the results obtained by Wang et al.( 5) Finally, large intersubject variability can be observed in TDF for oral breathing as compared to nasal breathing ( Figs 2 and 4).
Intersubject variability caused by SF and lung airway scaling
The values of the scaling factor SF are inversely proportional to the tracheal diameter or height of the subject. In the diffusion deposition regime, ET deposition efficiency is higher for lower values of SF, but exhibit the opposite behavior in the impaction regime. This highlights the fact that at younger ages (< 20 years) diffusion deposition is higher as compared to older ages, while an opposed trend can be observed in the impaction regime.
Scaling of the lung airways, approximated by FRC variations is not the only factor affecting deposition fractions but must be considered in combination with the breathing pattern of a given subject. Under sitting nasal breathing conditions and keeping all breathing parameters constant, for each 5 cm rise of the height of the subject, a 1 to7% decrease in TDF is observed in the impaction regime. For oral breathing conditions this decrease amount to 1 to 9%. In females relative to male subjects of the same age group, TDF increases by 2 to 5% due to lower FRC values. In diffusion regime, the effect of FRC variations on TDF is negligible.
Intersubject variability caused by SF, lung airway scaling and different breathing patterns
Intersubject variability for particle deposition tends to increase by up to 40% among the subjects if a third factor i.e. the breathing pattern of the subjects is combined with the other two factors i.e. SF and lung airways scaling, as discussed in the previous section. In some cases different breathing parameters produce compensatory effects; in others they enhance effects on particle deposition. Deposition fractions increase with diminishing breathing frequency when VT is kept constant in both the diffusion and impaction regimes. If both parameters, i.e. VT and breathing frequency, are increased or decreased simultaneously, they compensate each other and no significant effect on particle deposition is observed. In subjects with similar FRC and VT during nasal breathing, each increase in breathing time of 3 to 5 seconds, increase TDF up to 35% in diffusion regime and up to 30% in the impaction regime. During oral breathing, corresponding increases are 35% and 42%. For subjects with similar FRC and breathing times during nasal breathing leads to increases TDF up to 11% in the diffusion regime and up to 17% in the impaction regime for each 100 ml rise in VT. During oral breathing, corresponding increases are up to 15% and 14%. These results show that an increase in flow rate, either as a result of shorter breathing time or by higher tidal volumes affects TDF differently regardless of nasal or oral breathing. The contribution of ET deposition to TDF increases for higher tidal volume, where as the contribution of thoracic deposition to TDF increases with rising breathing times. This relatively high contribution of ET deposition in TDF with higher tidal volumes is due to the related increase in airways dimensions which consequently causes a lower thoracic deposition. On the other hand an increase in residence time without any change in airways dimensions results in higher deposition fraction in the thoracic region. The results predicted for both the TDF and the thoracic deposition are in accordance with the experimental results obtained by Kim et al. ( 33-37).
|
|
Conclusion
The variability in deposition fraction increases with the addition of influencing factors and the resulting standard deviations ranged up to 30%. The present calculations reveal that the range of the experimentally observed ET deposition efficiencies can be approximated by corresponding fluctuations of the Sf, Amin and d values. However in the absence of detailed nasal and oral geometric data, the use of scaling factor SF also provides a reasonable approximation of the intersubject variability of resulting deposition fractions. The variations of the breathing patterns partly caused by the above mentioned parameters and bronchial airway scaling, tend to increase the related variations in deposition fractions among the subjects by up to 40%. Hence, for individual dosimetric values, the effect of inter-subject variability in ET region must be considered. More reliable results for ET and total deposition can be obtained with a more precise determination of nasal or oral geometry, scaling of lung dimensions and considering the individual breathing habits of the subjects.
The parameter variations and resulting variations simulated in the present study refer to healthy lungs. The results obtained for healthy lung will as serve a baseline for future calculations for diseased lungs, which will further increase intersubject variability.
|
|
APPENDIX
1. Semi-empirical deposition equations for the extrathoracic (ET) region
1.1.Equations recommended by ICRP(6)
For fine particles < 0.2 μm equations 1 and 2 were proposed by Swift et al. ( 38) to calculate the deposition efficiencies for nasal and oral passages during inhalation. with scaling factor (SF)
with SF
where D (cm 2 s -1) is the diffusion coefficient and Q (ml s -1) is the flow rate. For particles ≥ 0.2 μm the equation 3 and 4 were derived by Rudolf et al. ( 39) and Stahlhofen et al., ( 40) to determine the deposition efficiencies for
nasal and oral passages during inhalation. with SF
with SF
where VT (ml) is the tidal volume and da (μm) is the particle aerodynamic
diameter.
Since differences between inhalation and exhalation are relatively small (about 10%), it is recommended to use equations 1-4 and 1a-4a for both inhalation and exhalation.
1.2.Equations recommended by NCRP(31)
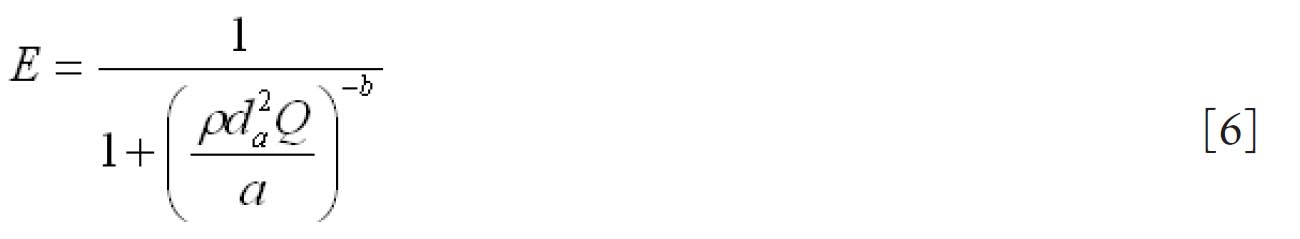
For fine particles < 0.2 μm NCRP( 31) adopted the following formulas (equations 5-6) based on a turbulent diffusion model proposed by Cheng et al.( 41) in which the deposition efficiency can be expressed as a function of the diffusion coefficient D(cm 2 s -1) and the flow rate Q (L min -1). The values of constant a for nasal ( N) and oral ( O) inhalation (i) and
exhalation (e) are given as follows: N i: a=12.8; N e: a=15.0; O i: a=10.3; O e: a=8.51 For particles ≥ 0.2 μm the following formulas obtained by Yeh et al.,( 42) by fitting of a logistic function to the summarized data of Yu et.al.( 43) are used. where ρ (g cm-3) is the particle density and da (μm) is the geometric
diameter. The coefficients a and b are experimentally derived parameters for inhalation and exhalation for both oral and nasal breathing:
Ni: a=4600 & b=0.94; Ne: a=2300 & b=1.01; Oi: a=30,000 & b=1.37; Oe: a=30,000 & b=1.37
1.3.Equation formulated by Martonen et al. (2)
The mathematical model of Martonen et al.( 2) describes diffusion deposition efficiency in the human ET region by Equation 7. This model combines the effect of turbulent and laminar flows where 70% turbulent and30 % laminar flow contribution provided the best fit to the experimental data for both nasal inhalation and exhalation. where the term 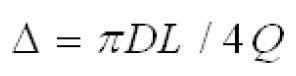 is a dimensionless diffusion parameter (L is the airway path length in units of centimetres) and is the Schmidt number (ν is the kinematic viscosity in units of (m 2s -1). 1.4.Equationsproposed by Cheng (10)
Cheng( 10) proposed equations 8 and 9 for regional nasal and oral deposition efficiencies in adult humans for both inhalation and exhalation. where and Q (L min-1) is the flow rate.
1.5.Equation derived by Asgharian et al. (20)
For nasal breathing (inhalation and exhalation), Asgharian et al. ( 29) fitted equation 10 for nano particles deposition accounting both axial diffusion and dispersion. where Q (L min-1) is flow rate.
1.6.Equation presened by Grgic et al.(11)
Grgic et al. ( 11) measured deposition in realistic mouth throat geometries
taken from seven subjects by MRI scans. The empirical function (equation
11) that predicts the mouth throat deposition is given by: where 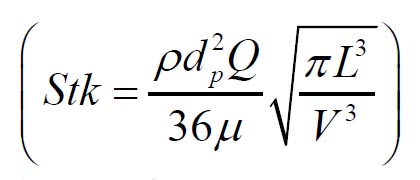 and 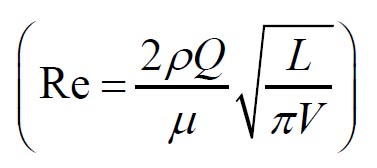 are Stokes and Reynolds numbers respectively which depend on mouth-throat volume
( V)and the centre line path length ( L) ( 11).
2. Semi-empirical deposition equations implemented into the IDEAL code
for the bronchial and the pulmonary region
2.1.Deposition by diffusion
2.1.1. For laminar flow Ingham ( 26) derived the following equation for the deposition efficiency in the human airways for laminar flow conditions: where flow rate is given in ml s-1.
2.1.2. For developing flow
For a replica cast of the upper bronchial airways Cohen and Asgharian( 27) derived the following empirical equation for the diffusion deposition efficiency (η D) of particles for turbulent flow conditions due to the branching of bronchial airways: 2.2. Deposition by Sedimentation
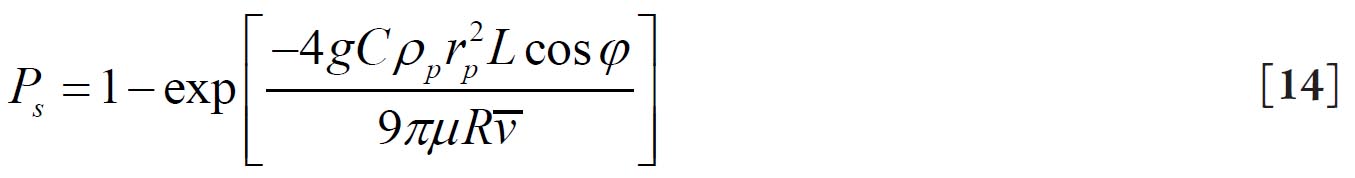
The deposition efficiency for sedimentation (P s) in cylindrical tubes was
suggested by Yeh and Schum( 28) where g is the acceleration of gravity, φ is the gravity angle relative to the horizontal line, i.e. perpendicular to the direction of gravity, ρp is the density of the particle, C is the Cunningham slip correction factor, rp is the particle radius, and μ is the viscosity of the fluid.
2.3. Deposition by Impaction
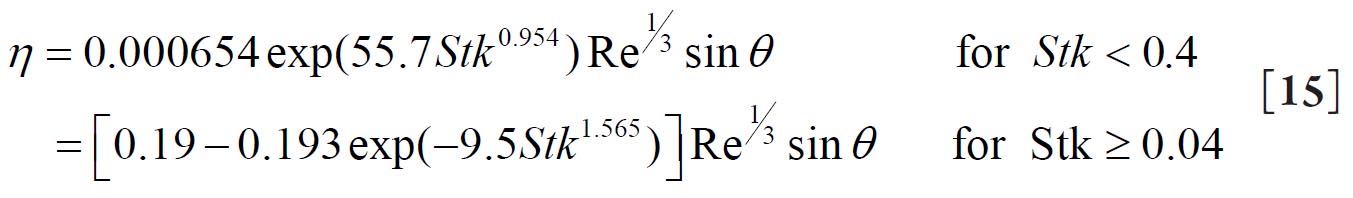
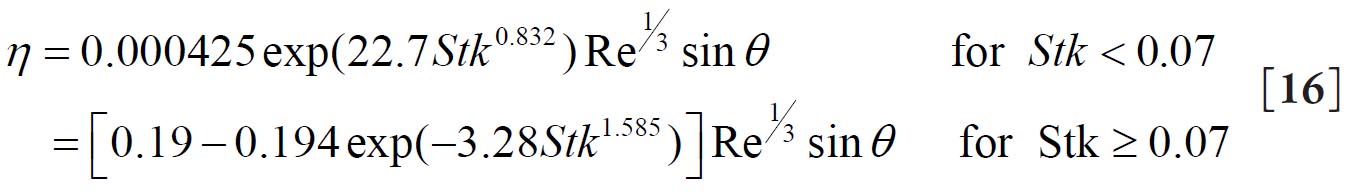
Zhang et al.( 29) derived following deposition equation cylindrical tubes by impaction: for parabolic flow and
for a uniform inflow, where θ is bend or branching angle measured in degrees.
|
|
References
- Sarangapani R, Wexler AS. Modelling particle deposition in extrathoracic airways. J Aerosol Sci Technol 2000;32:72–89.[LinkOut]
- Martonen TB, Zhang Z, Yue G, Musante CJ. Fine particle deposition within human nasal airways. Inhal Toxicol 2003;15:283–303.[LinkOut]
- Sosnowski TR, Moskal A, Gradon L. Dynamics of oropharyngeal aerosol transport and deposition with the realistic flow pattern. Inhal Toxicol 2006;18:773–80.[LinkOut]
- Sosnowski TR, Moskal A, Gradon, L. Mechanism of aerosol particle deposition in the oro-pharynx under non-steady airflow. Ann Occup Hyg 2007;51:19–25. [LinkOut]
- Wang SM, Inthavong K, Wen J, Tu JY, Xue CL. Comparison of micron and nanoparticle deposition patterns in a realistic human nasal cavity. Respir Physiol & Neur 2009;166:142–51.[LinkOut]
- International Commission on Radiological Protection (ICRP). Human respiratory tract model for radiological protection. Publication 66. Oxford: Elsevier Science; 1994.[LinkOut]
- Rasmussen TR, Swift DL, Hilberg O, Pedersen OF. Influence of nasal passage geometry on aerosol particle deposition in the nose. J Aerosol Med 1990;3:15–25.[LinkOut]
- Swift DL. Inspiratory inertial deposition of aerosols in human nasal airway replicate casts: implication for the proposed NCRP lung model. Rad Protec Dosimet 1991;38:29–34.[LinkOut]
- Zhang L, Yu CP. Empirical equations for nasal deposition of inhaled particles in small laboratory animals and humans. Aerosol Sci Technol 1993;19:51–6.[LinkOut]
- Cheng YS. Aerosol deposition in the extrathoracic region. Aerosol Sci Technol 2003;37:659–71.[LinkOut]
- Grgic B, Finlay WH, Burnell PKP, Heenan AF. In vitro intersubject and intrasubject deposition measurement in realistic mouth-throat gemetires. J Aerosol Sci 2004;35:1025-40.[LinkOut]
- Garcia GJM, Tewksbury EW, Wong BA, Kimbell JS. Interindividual Variability in Nasal Filtration as a Function of Nasal Cavity Geometry. J Aerosol Med & Pul Drug Deliv 2009;22:139–56.[LinkOut]
- Hofmann W, Bergmann R, Ménache MG. The effect of intersubject variability in airway morphology on intersubject variations in particle deposition. J Aerosol Sci 1998;29:s943–4.[LinkOut]
- Hofmann W, Asgharian B, Winkler-Heil R. Modeling intersubject variability of particle deposition in human lungs. J Aerosol Sci 2002;33:219–35.[LinkOut]
- Hofmann W, Morawska L, Bergmann R. Environmental tobacco smoke deposition in the human respiratory tract: Differences between experimental and theoretical approaches. J Aerosol Med 2001;14:317–26.[LinkOut]
- Hofmann W, Morawska L, Winkler-Heil R, Moustafa M. Deposition of combustion aerosols in the human respiratory tract: Comparison of theoretical predictions with experimental data considering nonspherical shape. Inhal Toxicol 2009;21:1154–64.[LinkOut]
- Cheng KH, Cheng YS, Yeh HS, Raymond A, Guilmette, Steven Q, et al. In vivo measurement of nasal airway dimension and ultrafine aerosol deposition in the human nasal and oral airways. J Aerosol Sci 1996;5:85–801.[LinkOut]
- Effmann EL, Fram, Evan K, Peter VK, Donald R. Tracheal cross-sectional area in children. Radiology 1983;149:137–40.[LinkOut]
- Hofmann W, Koblinger L. Monte Carlo modeling of aerosol deposition in human lungs. Part II: Deposition fractions and their parameter variations. J Aerosol Sci 1990;21:675–88.[LinkOut]
- Koblinger L, Hofmann W. Monte Carlo modeling of aerosol deposition in human lungs: Part I: Simulation of particle transport in a stochastic lung structure. J Aerosol Sci 1990;21:661–74.[LinkOut]
- Hofmann W, Begmann W, Koblinger L. Characterization of local particle deposition pattern in human and rate lungs by different morphometric parameters. J Aerosol Sci 1999;30:651–67.[LinkOut]
- Hofmann W, Sturm R, Fleming JS, Conway JH, Bolt L. Simulation of three-dimensional particle deposition patterns in human lungs and comparison with experimental SPECT data. J Aerosol Sci 2005;39:771–81.[LinkOut]
- Hofmann W, Winkler-Heil R, Balásházy I. The effect of morphological variability on surface deposition densities of inhaled particles in human bronchial and acinar airways. Inhal Toxicol 2006;18:809–19.[LinkOut]
- Raabe OG, Yeh HC, Schum GM, Phalen R. Tracheobronchial Geometry: Human, Dog, Rat, Hamster. Lovelace Foundation Report LF-53. Albuquerque, NM: Lovelace Foundation; 1976.[LinkOut]
- Haefeli-Bleuer B, Weibel ER. Morphometry of the human pulmonary acinus. Anat Rec 1988;220:401–14.[LinkOut]
- Ingham DB. Diffusion of aerosol in the entrance region of a smooth symmetrical pipe. J Aerosol Sci 1991;22:253–7.[LinkOut]
- Cohen BS, Asgharian B. Deposition of ultrafine particles in upper airways. J Aerosol Sci 1990;21:789–97.[LinkOut]
- Yeh HC, Schum GM. Models of human lung airways and their application to inhaled particle deposition. Bull Math Biophys 1980;42:461–80.[LinkOut]
- Zhang L, Asgharian B, Anjilvel S. Inertial deposition of particles in the human upper airway bifurcations. J. Aerosol Sci Technol 1997;26:97-110.[LinkOut]
- Asgharian B, Owen T, Price OT. Deposition of ultrafine (NANO) particles in the human lung. Inhal Toxicol 2007;19:1045–54.[LinkOut]
- National Council on Radiation Protection and Measurements (NCRP). Deposition, retention, and dosimetry of inhaled radioactive substances. Bethesda, MD;1997.[LinkOut]
- Borgström L, Olsson B, Thorsson L. Degree of throat deposition can explain the variability in lung deposition of inhaled drugs. J Aerosol Med 2006;19:473–83.[LinkOut]
- Kim CS, Hu SC, Dewitt P, Gerrity TR. Assessment of regional deposition of inhaled particles in human lungs by serial bolus delivery method. J Appl Physiol 1996;81:2203–13.[LinkOut]
- Kim CS, Hu S. Regional deposition of inhaled particles in human lungs: Comparison between men and women. J Appl Physiol 1998;84:1834–44.[LinkOut]
- Kim CS, Jaques PA. Analysis of total respiratory deposition of inhaled ultrafine particles in adult subjects at various breathing patterns. J Aerosol Sci Technol 2004;38:525–40.[LinkOut]
- Kim CS, Jaques PA. Total lung deposition of ultrafine particles in elderly subjects during controlled breathing. Inhal Toxicol 2005;17:387–99.[LinkOut]
- Kim CS, Hu SC. Total respiratory tract deposition of fine micrometer-sized particles in healthy adults: empirical equations for gender and breathing pattern. J Appl Physiol 2006;101:401–12.[LinkOut]
- Swift DL, Montassier N, Hopke PK, Karpen-Hayes K, Cheng YS, Su YF, et al. Inspiratory deposition of ultrafine particles in human nasal replicate casts. J Aerosol Sci 1992;23:65–72.[LinkOut]
- Rudolf G, Gebhart J, Heyder J, Schiller CF, Stahlhofen W. An empirical formula describing aerosol deposition in man for any particle size. J Aerosol Sci 1986;17:350-5.[LinkOut]
- Stahlhofen W, Rudolf G, James AC. Intercomparison of experimental regional aerosol deposition data. J Aerosol Med 1989;2:285–308.[LinkOut]
- Cheng YS, Yamada Y, Yeh HC. Deposition of ultrafine aerosols in a human oral cast. Aerosol Sci Technol 1990;12:1075–81.[LinkOut]
- Yeh HC, Cuddihy RG, Phalen RF, Chang IY. Comparisons of calculated respiratory tract deposition of particles based on the proposed NCRP model and ICRP 66 model. Aerosol Sci Technol 1996;25:134–40.[LinkOut]
- Yu CP, Diu CK, Soong TT. Statistical analysis of aerosol deposition in nose and mouth. Am Ind Hyg Assoc J 1981;42:726–33.[LinkOut]
Cite this article as:
Hussain M, Renate WH, Werner H. Effect of intersubject variability of extrathoracic morphometry, lung airways dimensions and respiratory parameters on particle deposition. J Thorac Dis 2011;3(3):156-170. doi: 10.3978/j.issn.2072-1439.2011.04.03
|

 , where Sf , is the average shape factor of the nasal turbinate region(
 , the where dimensionless Stokes number
  depends on the nasal cross sectional area Amin (
 , where Stk is the dimensionless Stokes number
  . This Stokes number depends on the characteristic length which is assumed to be the equivalent diameter of the average cross sectional area of the oropharyngeal region (
 , where H is measured in units of meter. This equation was obtained by fitting published data on the relationship between subject height and tracheal diameter (
 for males and
  for females.


 is a dimensionless diffusion parameter (L is the airway path length in units of centimetres) and is the Schmidt number (ν is the kinematic viscosity in units of (m2s-1).


 and
and are Stokes and Reynolds numbers respectively which depend on mouth-throat volume
(V)and the centre line path length (L) (
are Stokes and Reynolds numbers respectively which depend on mouth-throat volume
(V)and the centre line path length (L) (